
The basic parameters of 3-phase electrical supply may not all be perfect
Engineers, particularly Mechanical Engineers, often assume that the electrical supply to their equipment is at exactly the nominal voltage (eg 240 or 415 volts), and exactly the nominal frequency (eg 50 or 60Hz), with the current and voltage waveforms perfectly sinusoidal in shape (if they ever thought about them at all), with three phases all equal in magnitude, all similar in shape, and all at 120 degrees spacing from one another.
The truth is that the real world situation can be significantly different from this perfect world picture, and some of the differences can have consequences for the behaviour and reliability of your equipment.
In addition, your equipment can affect the power supply, particularly in areas such as the Power Factor for your site, and raised levels of harmonic distortion, put back onto your network.
Much of the time, you don’t actually know what the situation is – on a few assets you may have meters showing you overall voltage and current, but rarely do you have information on the actual frequency, phase balance, harmonic distortion or power factor, and even more rarely still do you get to see the shape of the voltage and current waveforms. When you install a Faraday Predictive system, suddenly this information is fully visible to you, and you can see not only what the values are, but how they can vary from day to day, and from minute to minute.
What does a three-phase electricity supply look like?

The image above shows the three-phase voltage and three-phase current being drawn by a small motor, powered by an inverter. The three voltage traces are the paler ones, slightly smaller in magnitude than the currents. The three-phase currents are the darker ones, with noticeably spikey distortion, particularly around the peaks. Note how they are different in shape from a pure sine wave.
Things to notice about this sort of three phase picture:
Voltage levels in a 3-phase supply:
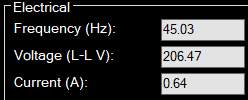
The voltage traces on the plot have peaks that are approximately 170v above and below zero (left hand axis). As an AC system, the figure we normally quote (eg 240v) is an RMS value, which corresponds to the DC figure that would give the same energy level. If the traces were perfect sine waves, the ratio between the value of the RMS figure and the peak would be the square root of 2. So in this case, with a peak of around 170v, we’d expect an RMS value of around 170/1.4 = 121v. So why is the voltage figure in the table, detail shown below, 206v, which is more than the peak value, instead of 121v?
Current levels in a 3-phase supply:
Phase balance:

Distortion:

Active Power/Reactive Power & Phase Angle / Power Factor


Low power factor is to be avoided if possible, since the reactive current does no useful work but still represents current flowing in the windings, resulting in resistive losses in the windings (“copper losses”) and reactive losses in the core (“iron losses”) which represent wasted energy, and raise the temperature of the motor, which can be bad for reliability.
Why should I worry about the quality of the mains power supply?
Phase balance can be important for two reasons
Firstly, an unbalanced supply to a motor results in the motor creating an oscillating torque output.
If you were to plot the torque as the motor rotates on a polar plot, in an ideal world, with a perfectly balanced 3-phase supply, the torque plot would be a perfect circle, because the three phases, each at 120o apart, create a rotating magnetic field of constant strength, rotating at constant speed.
However, if the three phases are not perfectly balanced, the magnetic field will be stronger in the windings corresponding to the stronger phase, and weaker in the windings corresponding to the weaker phase. So the torque will be stronger or weaker as each of the phases in turn pass through their alternating cycle. Note that this effect occurs on both the positive and negative parts of the cycle, so it will occur at twice line frequency. On a two pole motor, this means the torque plot will be elliptical rather than circular. On a four pole machine (which rotates at half the speed) the torque plot will be a somewhat squared-off circle.
This variation in torque puts additional (fatigue) stresses on elements such as shafts and couplings.
Secondly, an unbalanced supply leads to motor heating which reduces the motor life (and wastes energy).
As a rule of thumb, a 1% voltage unbalance leads to a 5% current unbalance; and a 5% current unbalance leads to a 10oC rise in motor temperature; and a 10oC rise in motor temperature halves the life of the motor windings (through more rapid ageing of the insulation). So unbalance is to be avoided if possible. AND heating indicates wasted energy, so it represents an opportunity for energy saving if we can eliminate it.
Harmonic distortion is important for two reasons
Firstly it creates motor heating:
the distortions represent current flowing in and out of the motor, which don’t contribute to driving the rotation forward. However, they incur resistance in the windings (copper losses) and create eddy currents in the core (iron losses) which waste energy, which appears as heat. So as with unbalance supply, a 10oC rise in motor temperature halves the life of the windings and wastes energy.
Secondly, it can contribute to shaft currents
which in turn can lead to electric currents flowing through bearings, causing arcing between the balls and the races, and resulting in rapid damage to bearings, with some characteristic “fluted” damage patterns.
Power Factor can be important
to the extent that your electricity supplier may charge you extra for your power if you have a low power factor. This is because although you only use energy in the real power, the supply system has to be rated to carry the maximum current you draw, and with a low power factor, the current is increased by the factor of 1/cos phi.